🇮🇹 Italian Schools Analysis Project (2025)
🎯 1 Project Objectives
This analysis project aims to provide a clear, structured framework for exploring and interpreting the raw data on Italian public schools. The primary goals are:
- Data Normalization: To transform the complex source data into an easily consumable, relational Excel format, facilitating further analysis and custom querying by end-users.
- Geographical Distribution: To analyze the concentration and distribution of educational institutions across Italy’s regions and provinces, identifying potential regional disparities.
- School Type Profiling: To categorize and compare the number of institutions based on their Tipologia (school type) to profile the educational system’s structure.
- Foundation for Further Study: To serve as a validated and reliable starting point for further socio-economic or demographic studies.
🖼️ 2 Project Overview
This image represents the final result of the analysis, specifically the Choropleth Map showing the “Distribuzione scuole statali nelle regioni italiane” (Distribution of state schools in Italian regions):
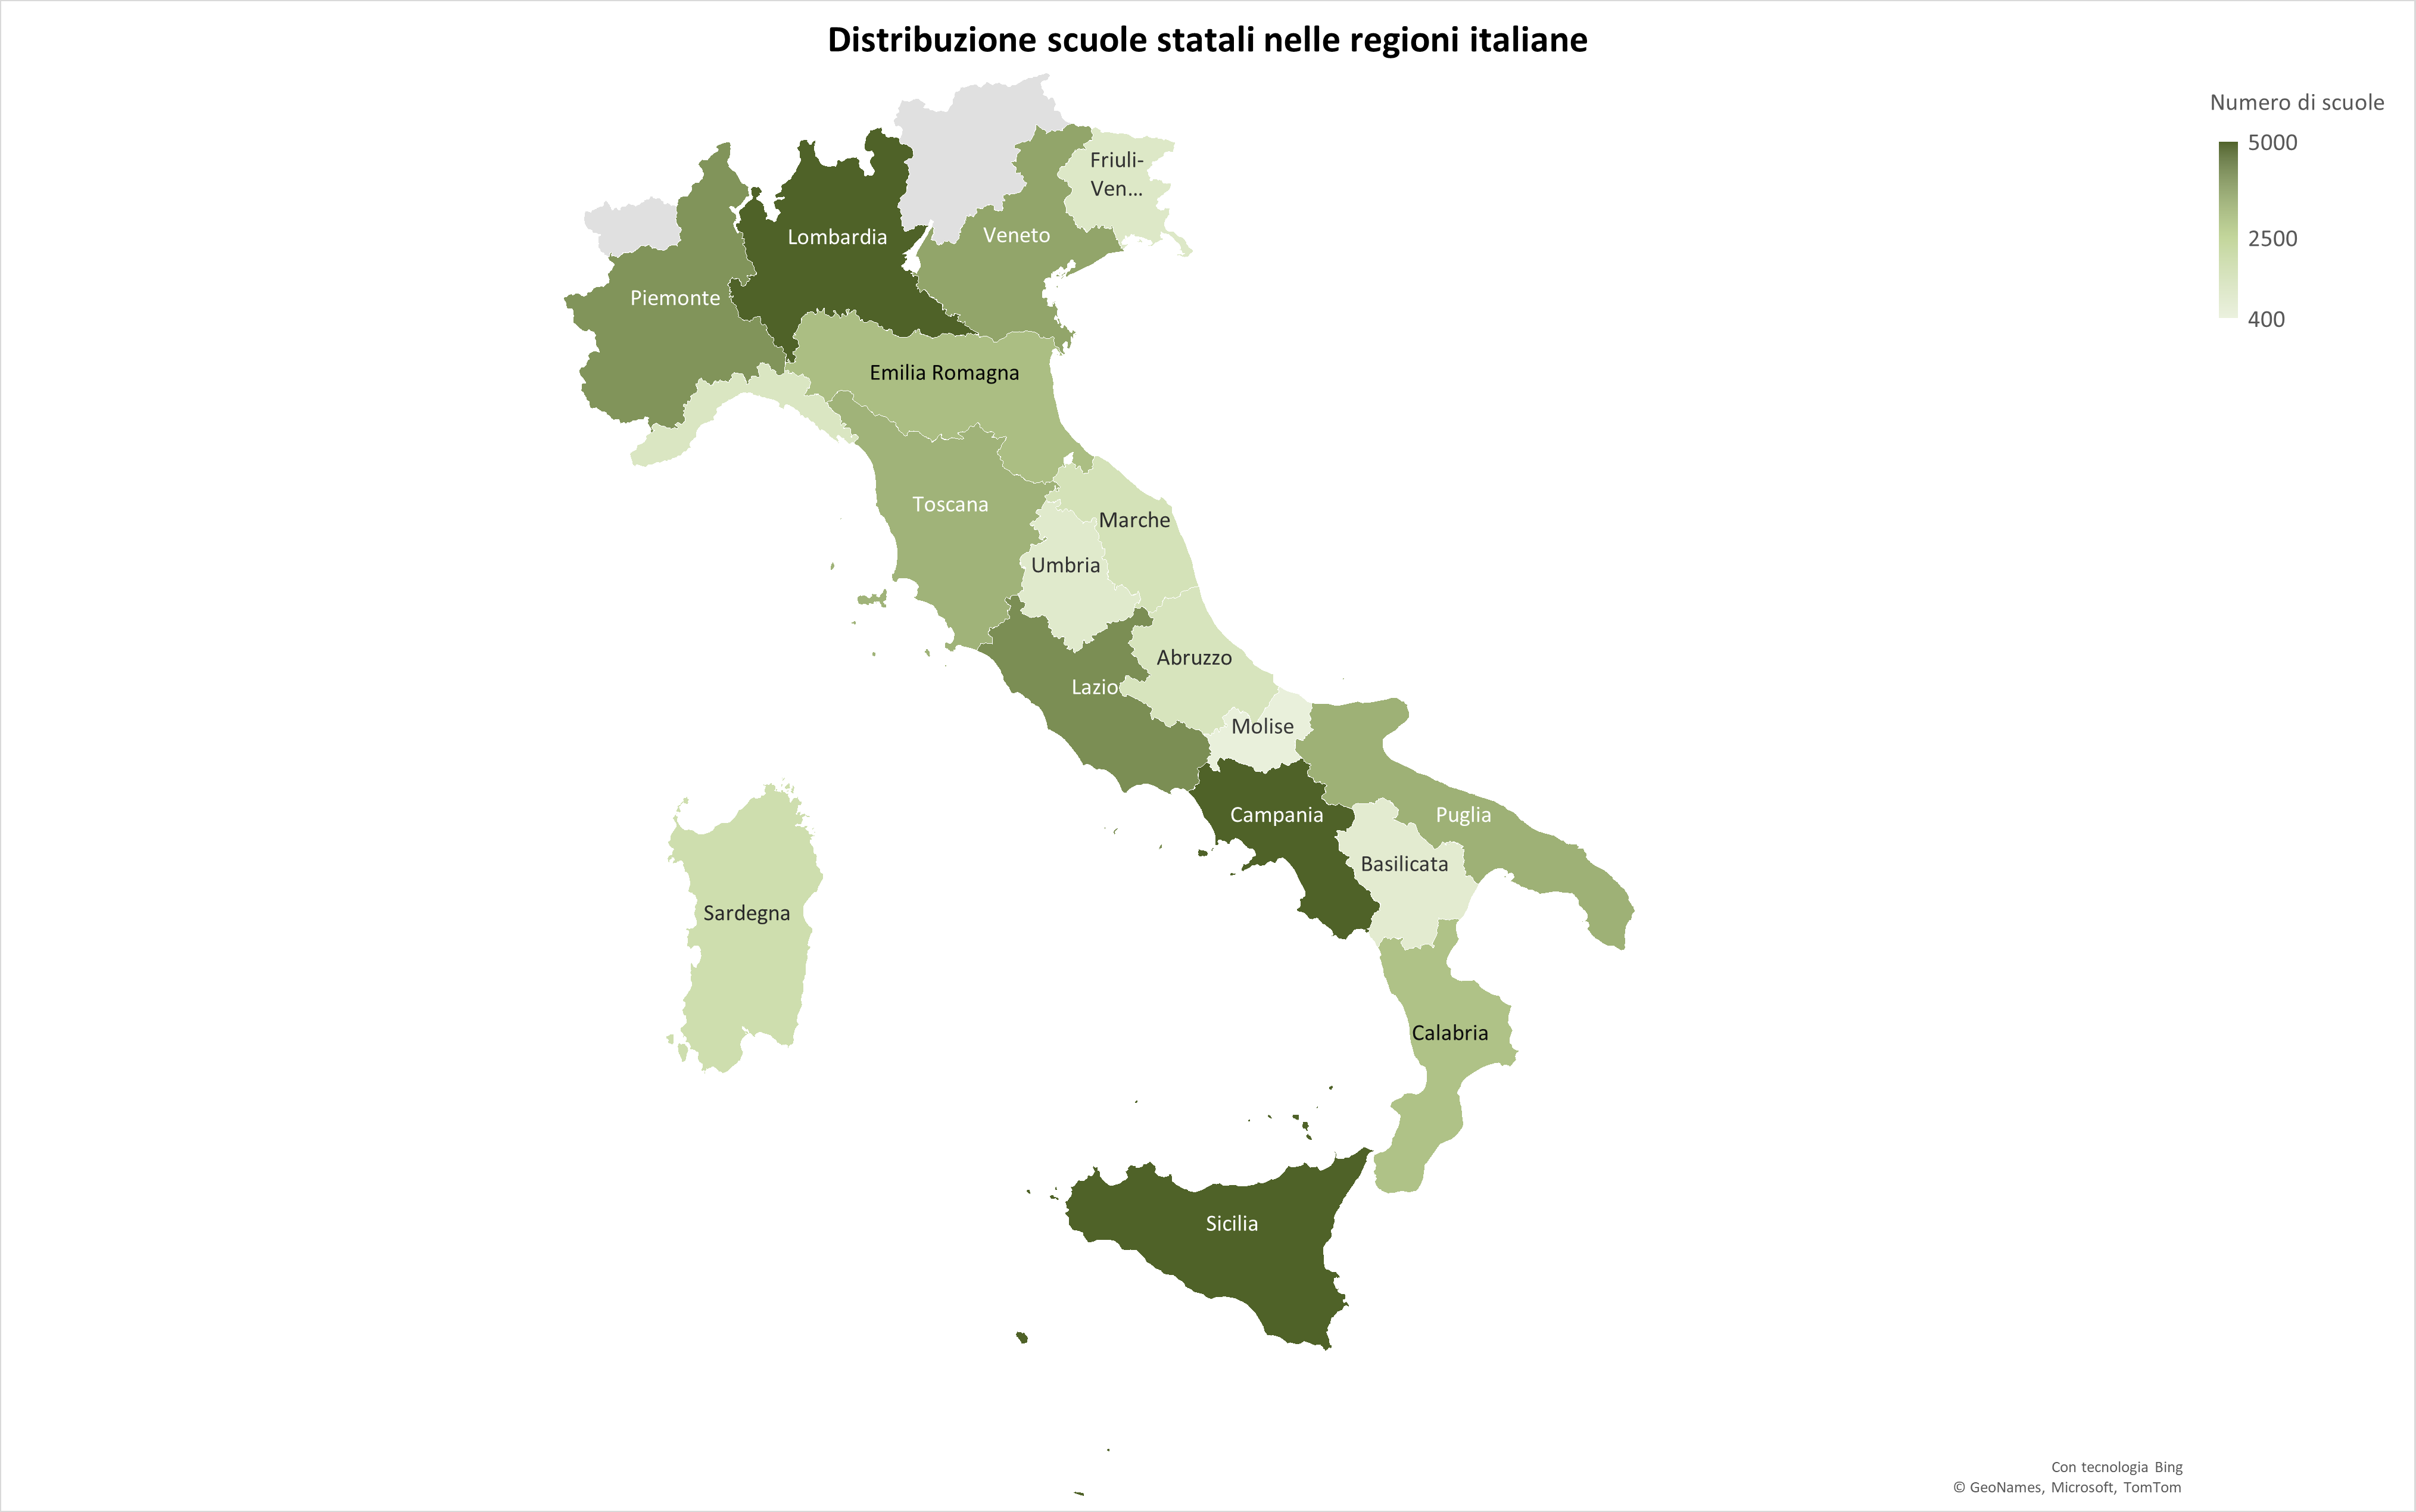
Figure 1: Choropleth map showing the distribution of state schools in Italian regions.
📊 3 Data Source Overview
The analysis is based on the following initial file:
File: School_Analysis.xlsx
This file contains information for 51,091 public schools in Italy for the academic year 2025/2026. The Excel file is structured across 4 sheets: scuole, tipologie, comuni, and province.
3.1 Origin and Adaptation
The data was adapted and simplified from the original CSV file:
SCUANAGRAFESTAT20252620250901.csv
The source data is openly published by the Ministry of Education (MIUR).
Source Link: Dati Istruzione (MIUR) - Distribuzione 2025/2026 (To download the original CSV file, click on “Distribuzione per ANNOSCOLASTICO 202526” on the source page.)
🏛️ 4 Main Data Sheet: “scuole”
The “scuole” sheet holds the core institutional data. Below is a detailed description of the main columns included in this file:
| Column Name | Description |
|---|---|
| ScuolaID | Unique numeric identifier for the school, used as the primary key. |
| CodiceScuola | Official alphanumeric Ministry of Education code for the school. |
| DenominazioneScuola | Full, official name of the school. |
| ComuneID | Foreign key linking the school to the corresponding Comune (municipality) in the “comuni” lookup sheet. |
| TipologiaID | Foreign key linking the school to the corresponding school type (Tipo di scuola) in the “tipologie” lookup sheet. |
4.1 Data Structure Visual
The structure of the main sheet is shown below for quick reference:
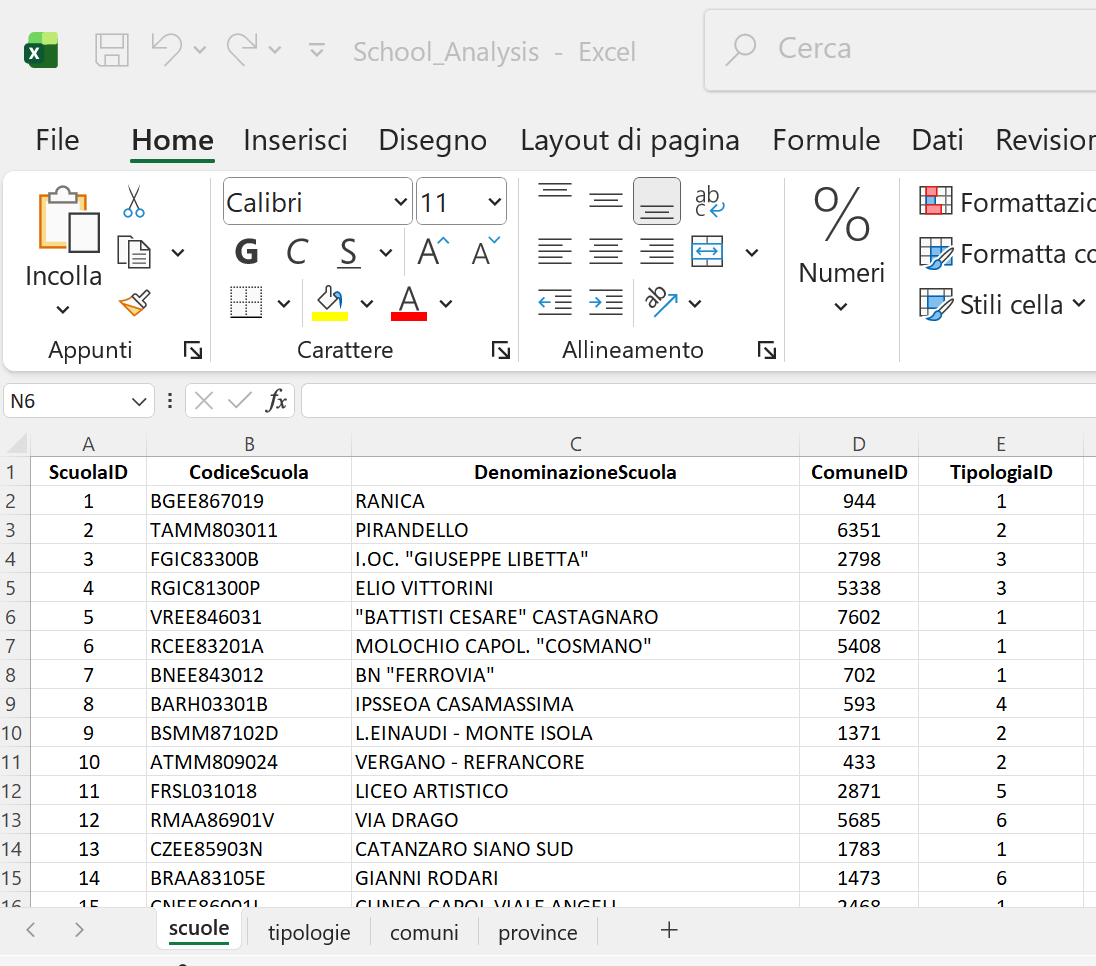
Figure 2: Structure of the “scuole” sheet, showing columns linking each school to Comuni and Tipologie.
🔎 5 Lookup Sheets
The School_Analysis.xlsx file includes three supporting sheets used to normalize and categorize data found in the main “scuole” sheet.
5.1 Tipologie (School Types)
This small lookup sheet defines the classification of schools by type (e.g., Primary School, Secondary School, etc.). It helps to easily filter the main data.
| Column Name | Description |
|---|---|
| TipologiaID | Unique numeric identifier for the school type (Primary Key). |
| Tipologia | Full description of the school type. |
5.2 Comuni (Municipalities)
This sheet provides geographical data for the municipalities where the schools are located.
| Column Name | Description |
|---|---|
| ComuneID | Unique numeric identifier for the Municipality (Primary Key), referenced by the “scuole” sheet. |
| Comune | Official name of the Italian Municipality. |
| ProvinciaID | Foreign key linking the Comune to the corresponding Province (Provincia) in the “province” lookup sheet. |
5.3 Province (Provinces)
This sheet is the highest-level geographical lookup, linking municipalities to their respective provinces.
| Column Name | Description |
|---|---|
| ProvinciaID | Unique numeric identifier for the Province (Primary Key), referenced by the “comuni” sheet. |
| Provincia | Full name of the Italian Province. |
| Sigla | Official two-letter abbreviation/code for the Province. |
📝 6 Data Enrichment and Analysis Setup
After normalizing the data model, the core “scuole” sheet was enriched by adding descriptive columns using Excel lookup functions (VLOOKUP and XLOOKUP) applied across the four sheets.
A new file, School_Analysis_VLOOKUP_XLOOKUP.xlsx, was created for this step. The following descriptive columns were added and populated:
| Target Column | Description | Lookup Function |
|---|---|---|
| Comune | Municipality name | VLOOKUP |
| Tipologia di scuola | Type of school | VLOOKUP |
| Provincia | Province name | XLOOKUP |
| Sigla Provincia | Province abbreviation | XLOOKUP |
6.1 Lookup Formulas Used:
The formulas used to link the descriptive data back to the main sheet were:
| Target Column | Formula Logic (English) | Keys Used |
|---|---|---|
| Comune | =VLOOKUP(D2, comuni!A:B, 2, FALSE) |
ComuneID against comuni!ComuneID |
| Tipologia di scuola | =VLOOKUP(F2, tipologie!A:B, 2, FALSE) |
TipologiaID against tipologie!Tipologia |
| Provincia | =XLOOKUP(D2, comuni!A:A, comuni!D:D) |
ComuneID against comuni!ProvinciaID |
| Sigla Provincia | =XLOOKUP(H2, province!B:B, province!C:C) |
Provincia name against province!Sigla |
🖼️ 6.2 File Visuals
The following views of the enriched scuole sheet in School_Analysis_VLOOKUP_XLOOKUP.xlsx illustrate the column structure and the application of the lookup formulas:
- View 1 - Initial Enrichment:

Figure 3: Initial Enrichment. The main sheet structure after adding the first descriptive columns.
- View 2 - Tipologia Lookup:
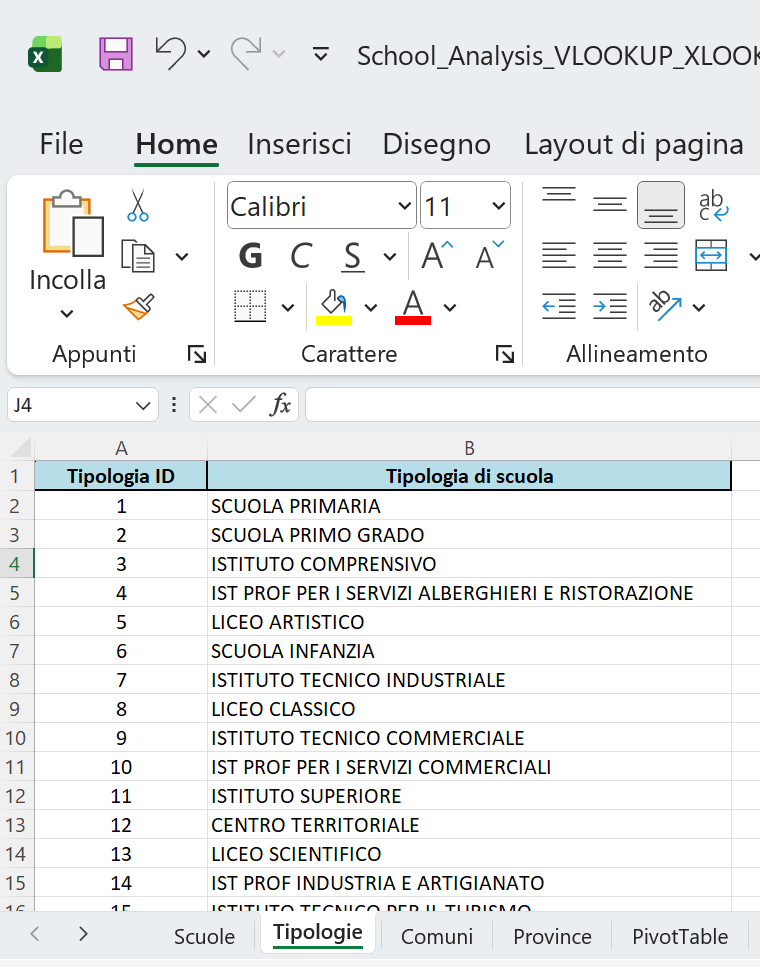
Figure 4: Tipologia Lookup. VLOOKUP is used to populate the ‘Tipologia di scuola’ column using the ‘tipologie’ sheet.
- View 3 - Comune/ProvinciaID Lookup:
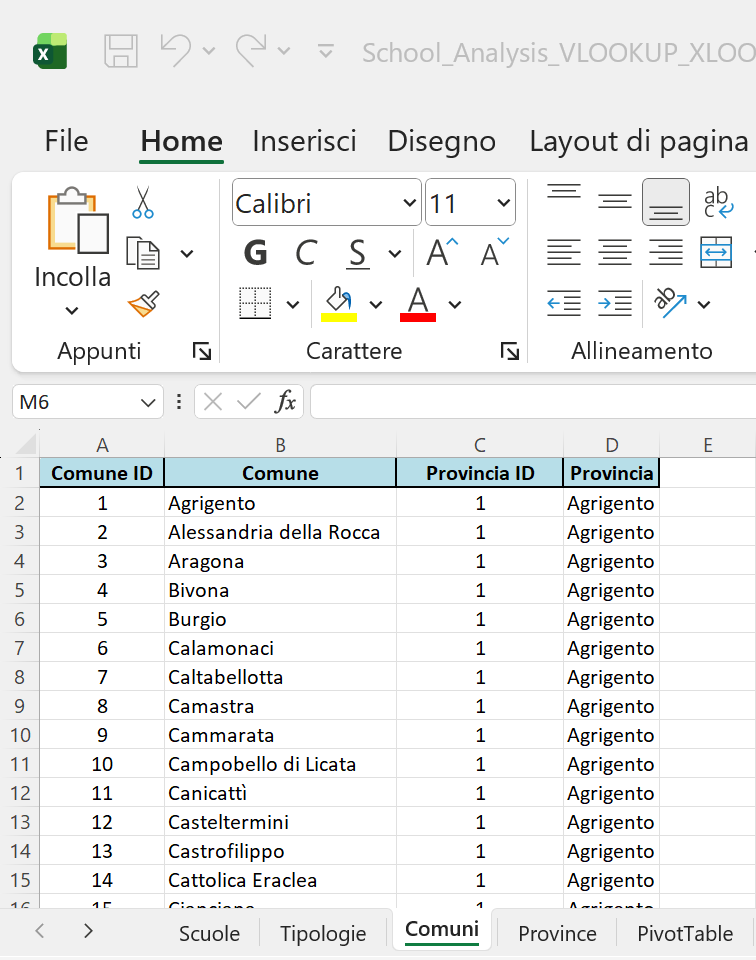
Figure 5: Comune Lookup. VLOOKUP and XLOOKUP operations used to retrieve Municipality details.
- View 4 - Sigla Provincia Lookup:
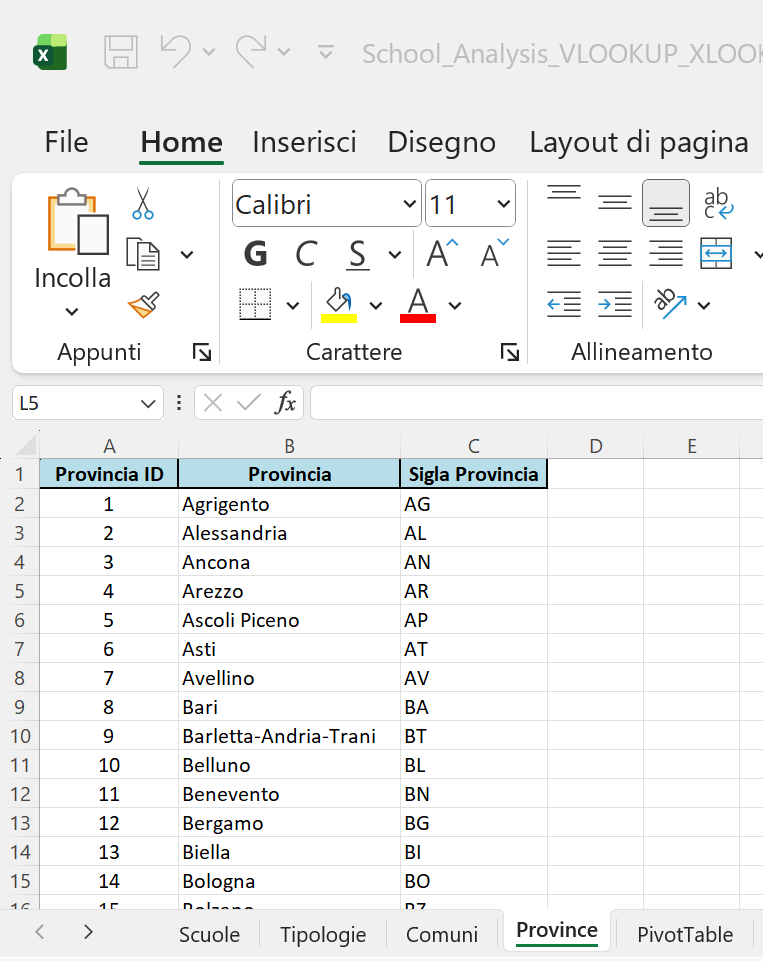
Figure 6: Province Lookup. XLOOKUP is used to finalize geographical details, retrieving the ‘Sigla Provincia’.
📈 7 Pivot Table Analysis
Following the data enrichment, a Pivot Table was created to quickly analyze the distribution of school types across the different provinces.
7.1 Pivot Table Structure
A new sheet, “PivotTable”, was created with the following structure:
- Rows: “Tipologia di scuola” and “Provincia”
- Values: Count of “Tipologia di scuola” (to count the number of schools)
This configuration allows for drilling down into the specific count of each school type per province.
7.2 Visual Analysis
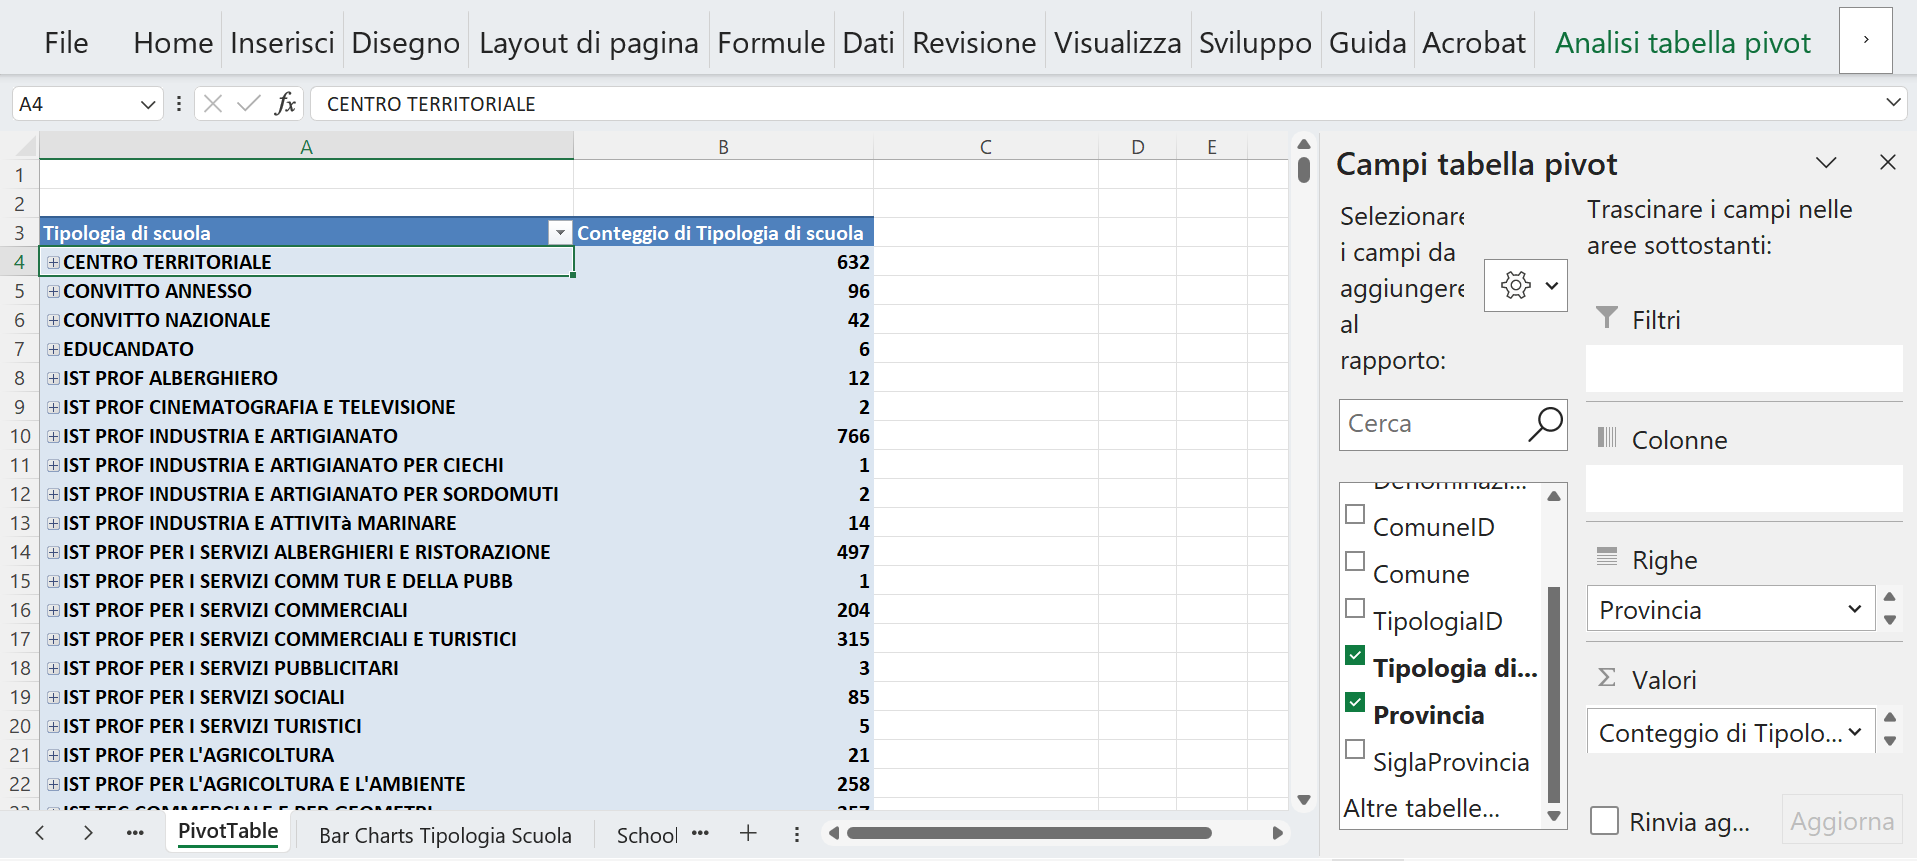
Figure 7: Structure Overview. The structure of the Pivot Table Analysis, showing “Tipologia di scuola” (type of school) in the first column, grouped by type.
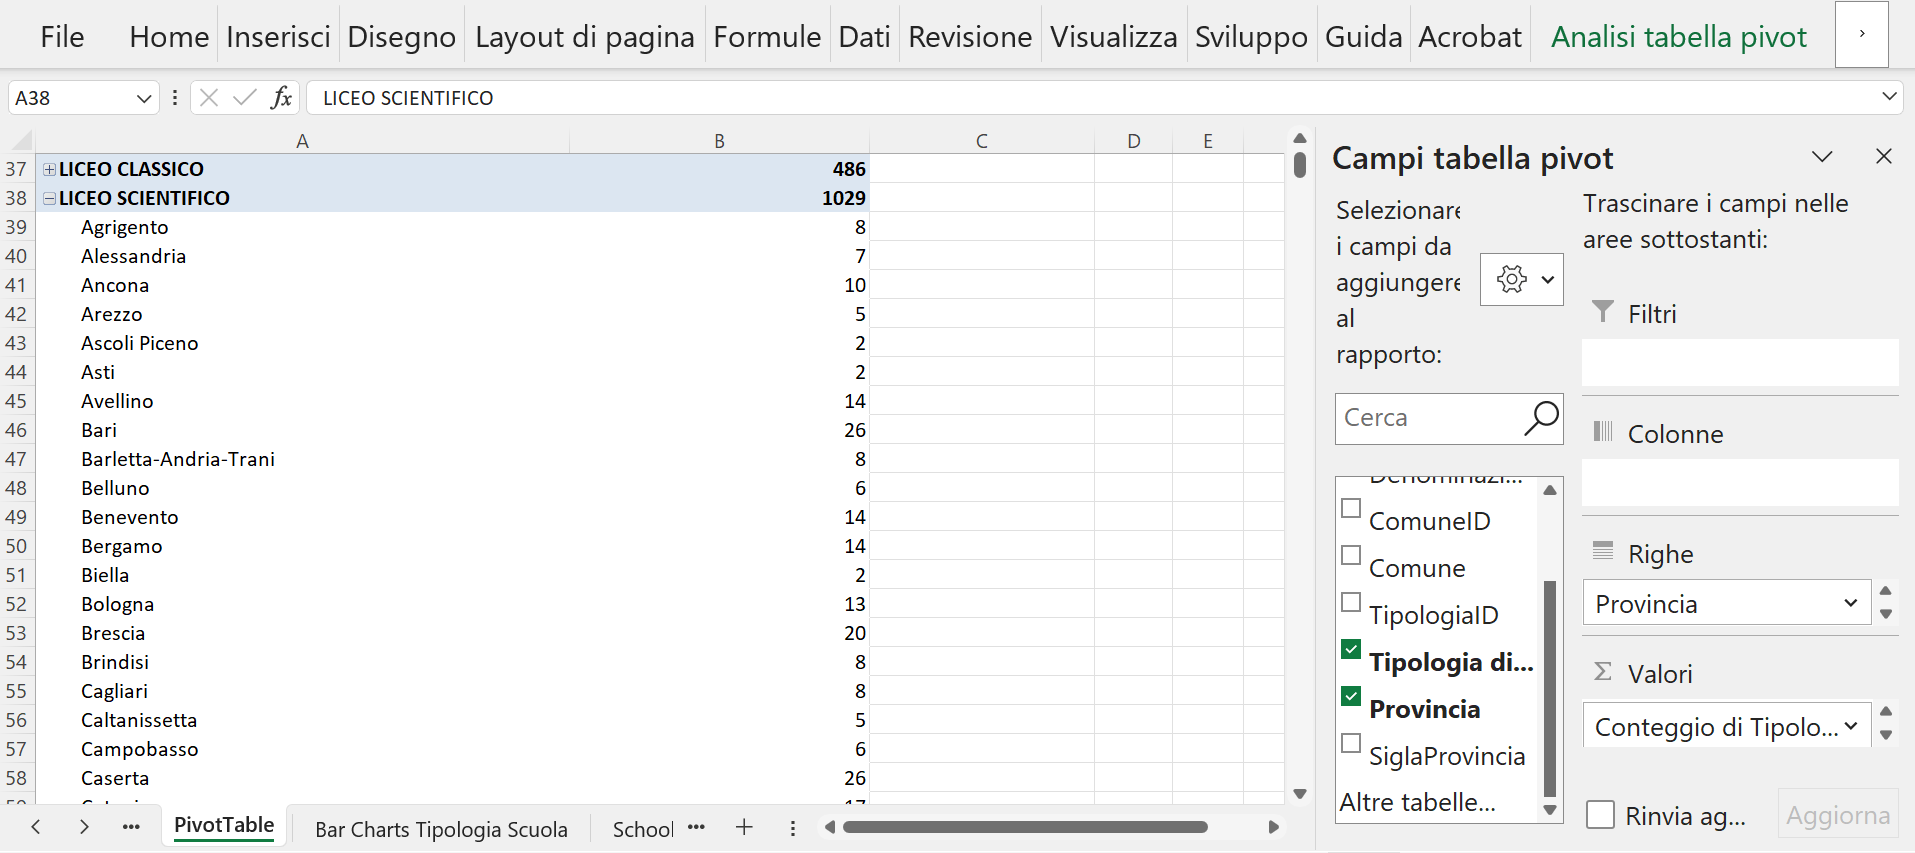
Figure 8: Detailed view of the ‘Liceo Scientifico’ category, showing a total of 1,029 schools distributed alphabetically across the various provinces (e.g., 8 in Agrigento, 7 in Alessandria, 10 in Ancona).
7.3 Analysis Refinement: Granularity by Municipality
By further modifying the Pivot Table structure and adding the “Comune” field to the Rows area, the analysis achieves a finer level of detail. This action allows the count of each type of school to be displayed not just by Province, but broken down by individual Municipality.
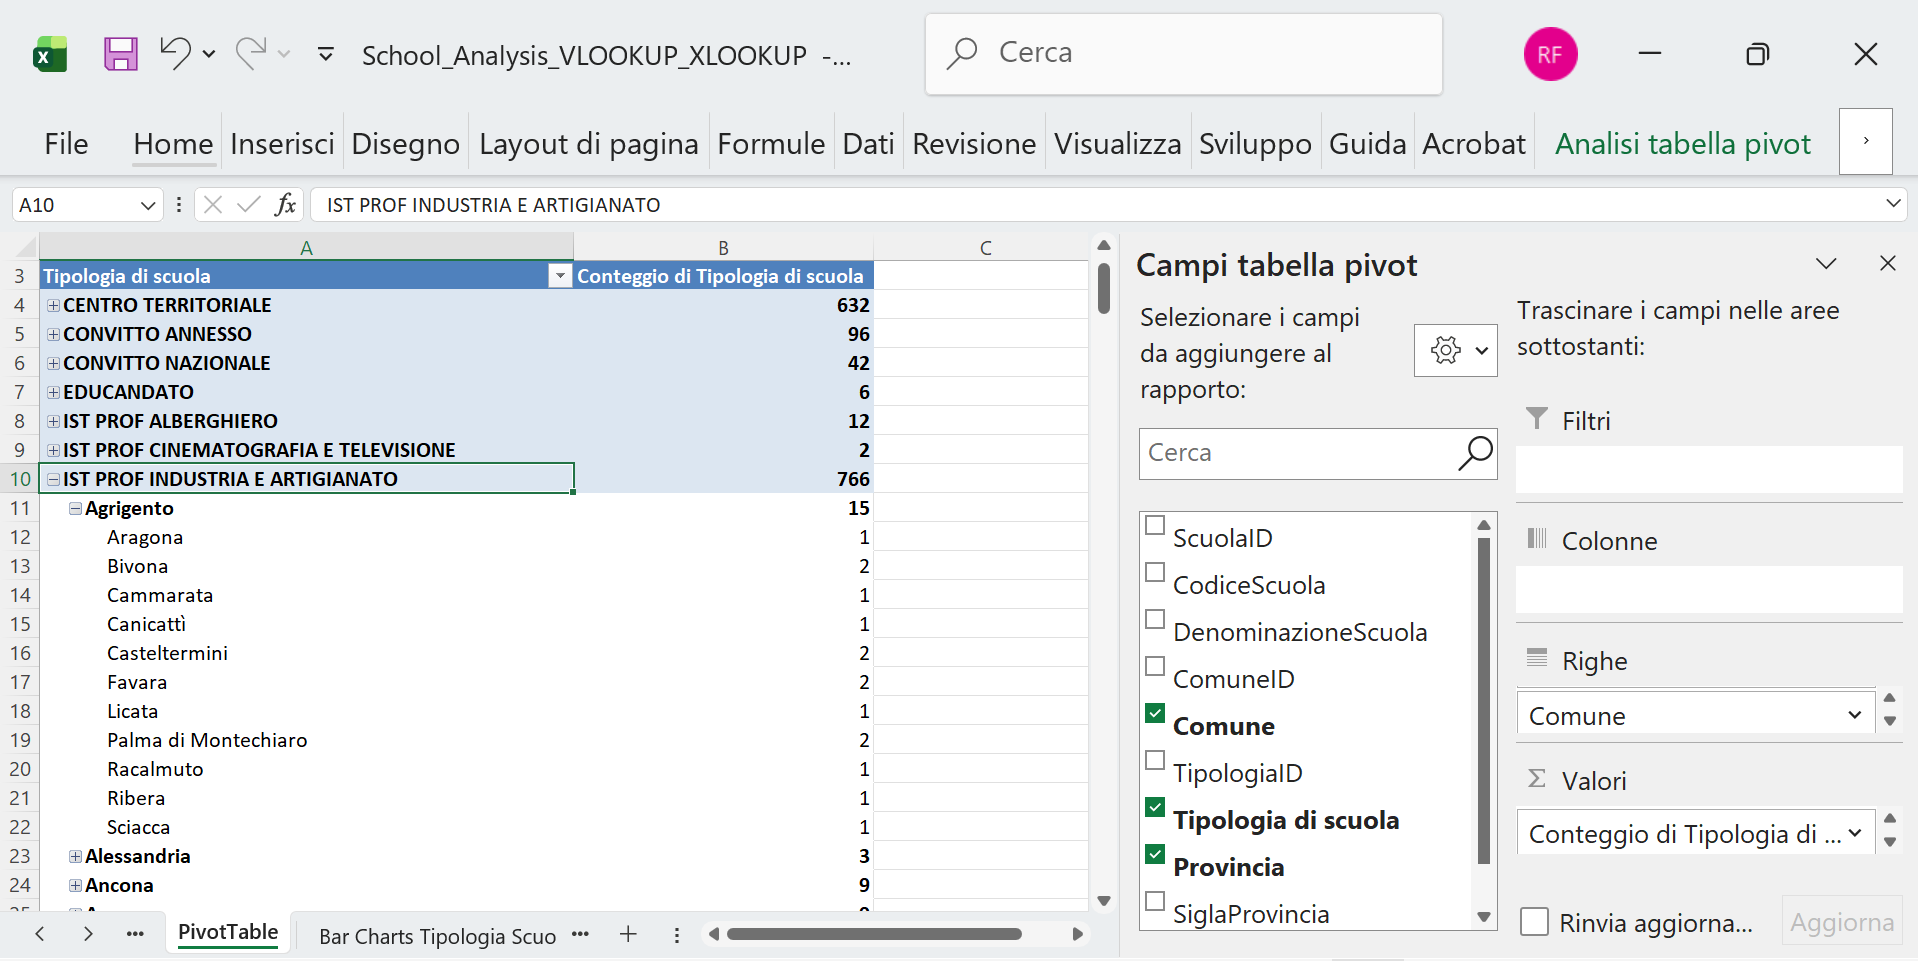
Figure 9: The structure of the Pivot Table after adding the ‘Comune’ field to the Rows area for deeper geographic granularity.
7.4 Visualizing Distribution: Bar Charts Analysis
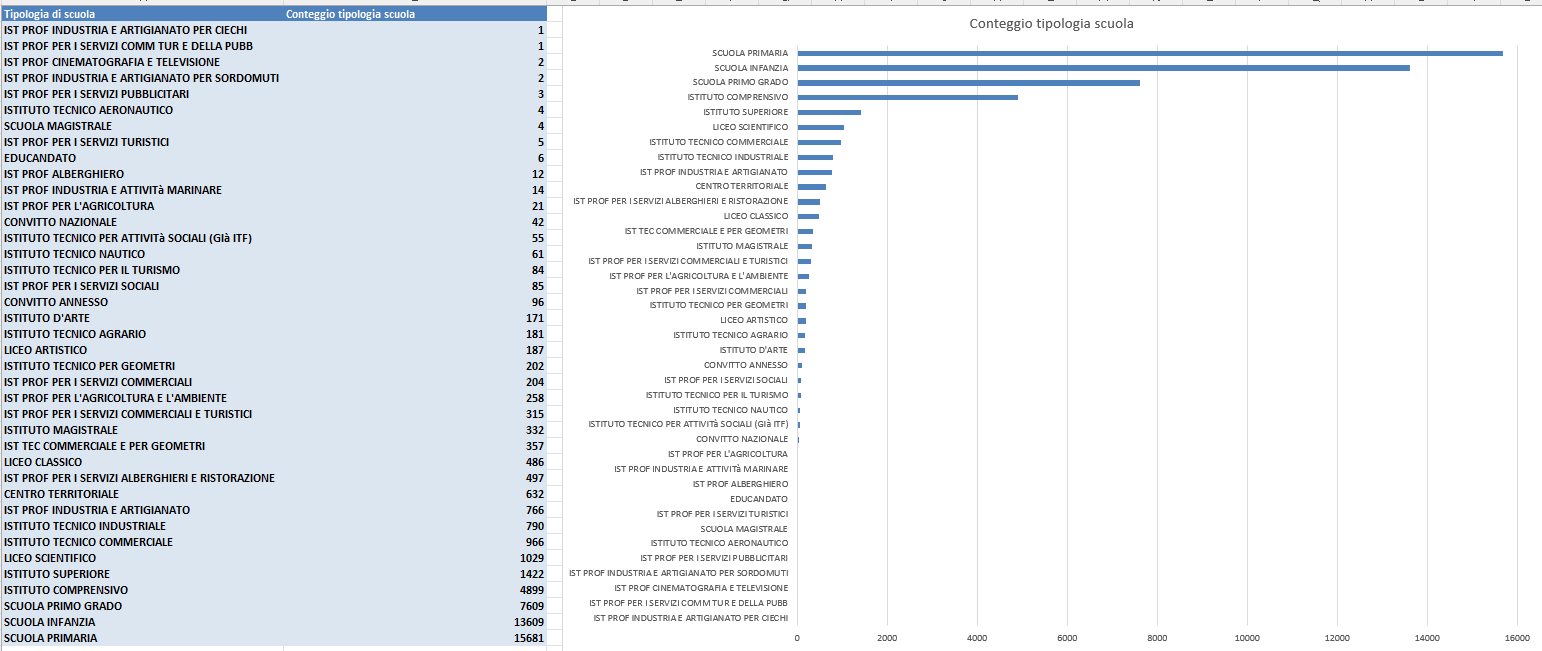
To better visualize the quantitative differences between school types, data from the Pivot Table was copied and pasted into a new sheet, “Bar Charts Tipologia Scuola”.
A bar chart, titled “Conteggio tipologia scuola per Provincia” (Count of school types per Province), was created and sorted in descending order based on the count.
7.5 Key Findings & Visualization Adjustments:
The analysis immediately highlights the dominance of categories like Scuola primaria (Primary school), Infanzia, Primo grado, and Istituto comprensivo.
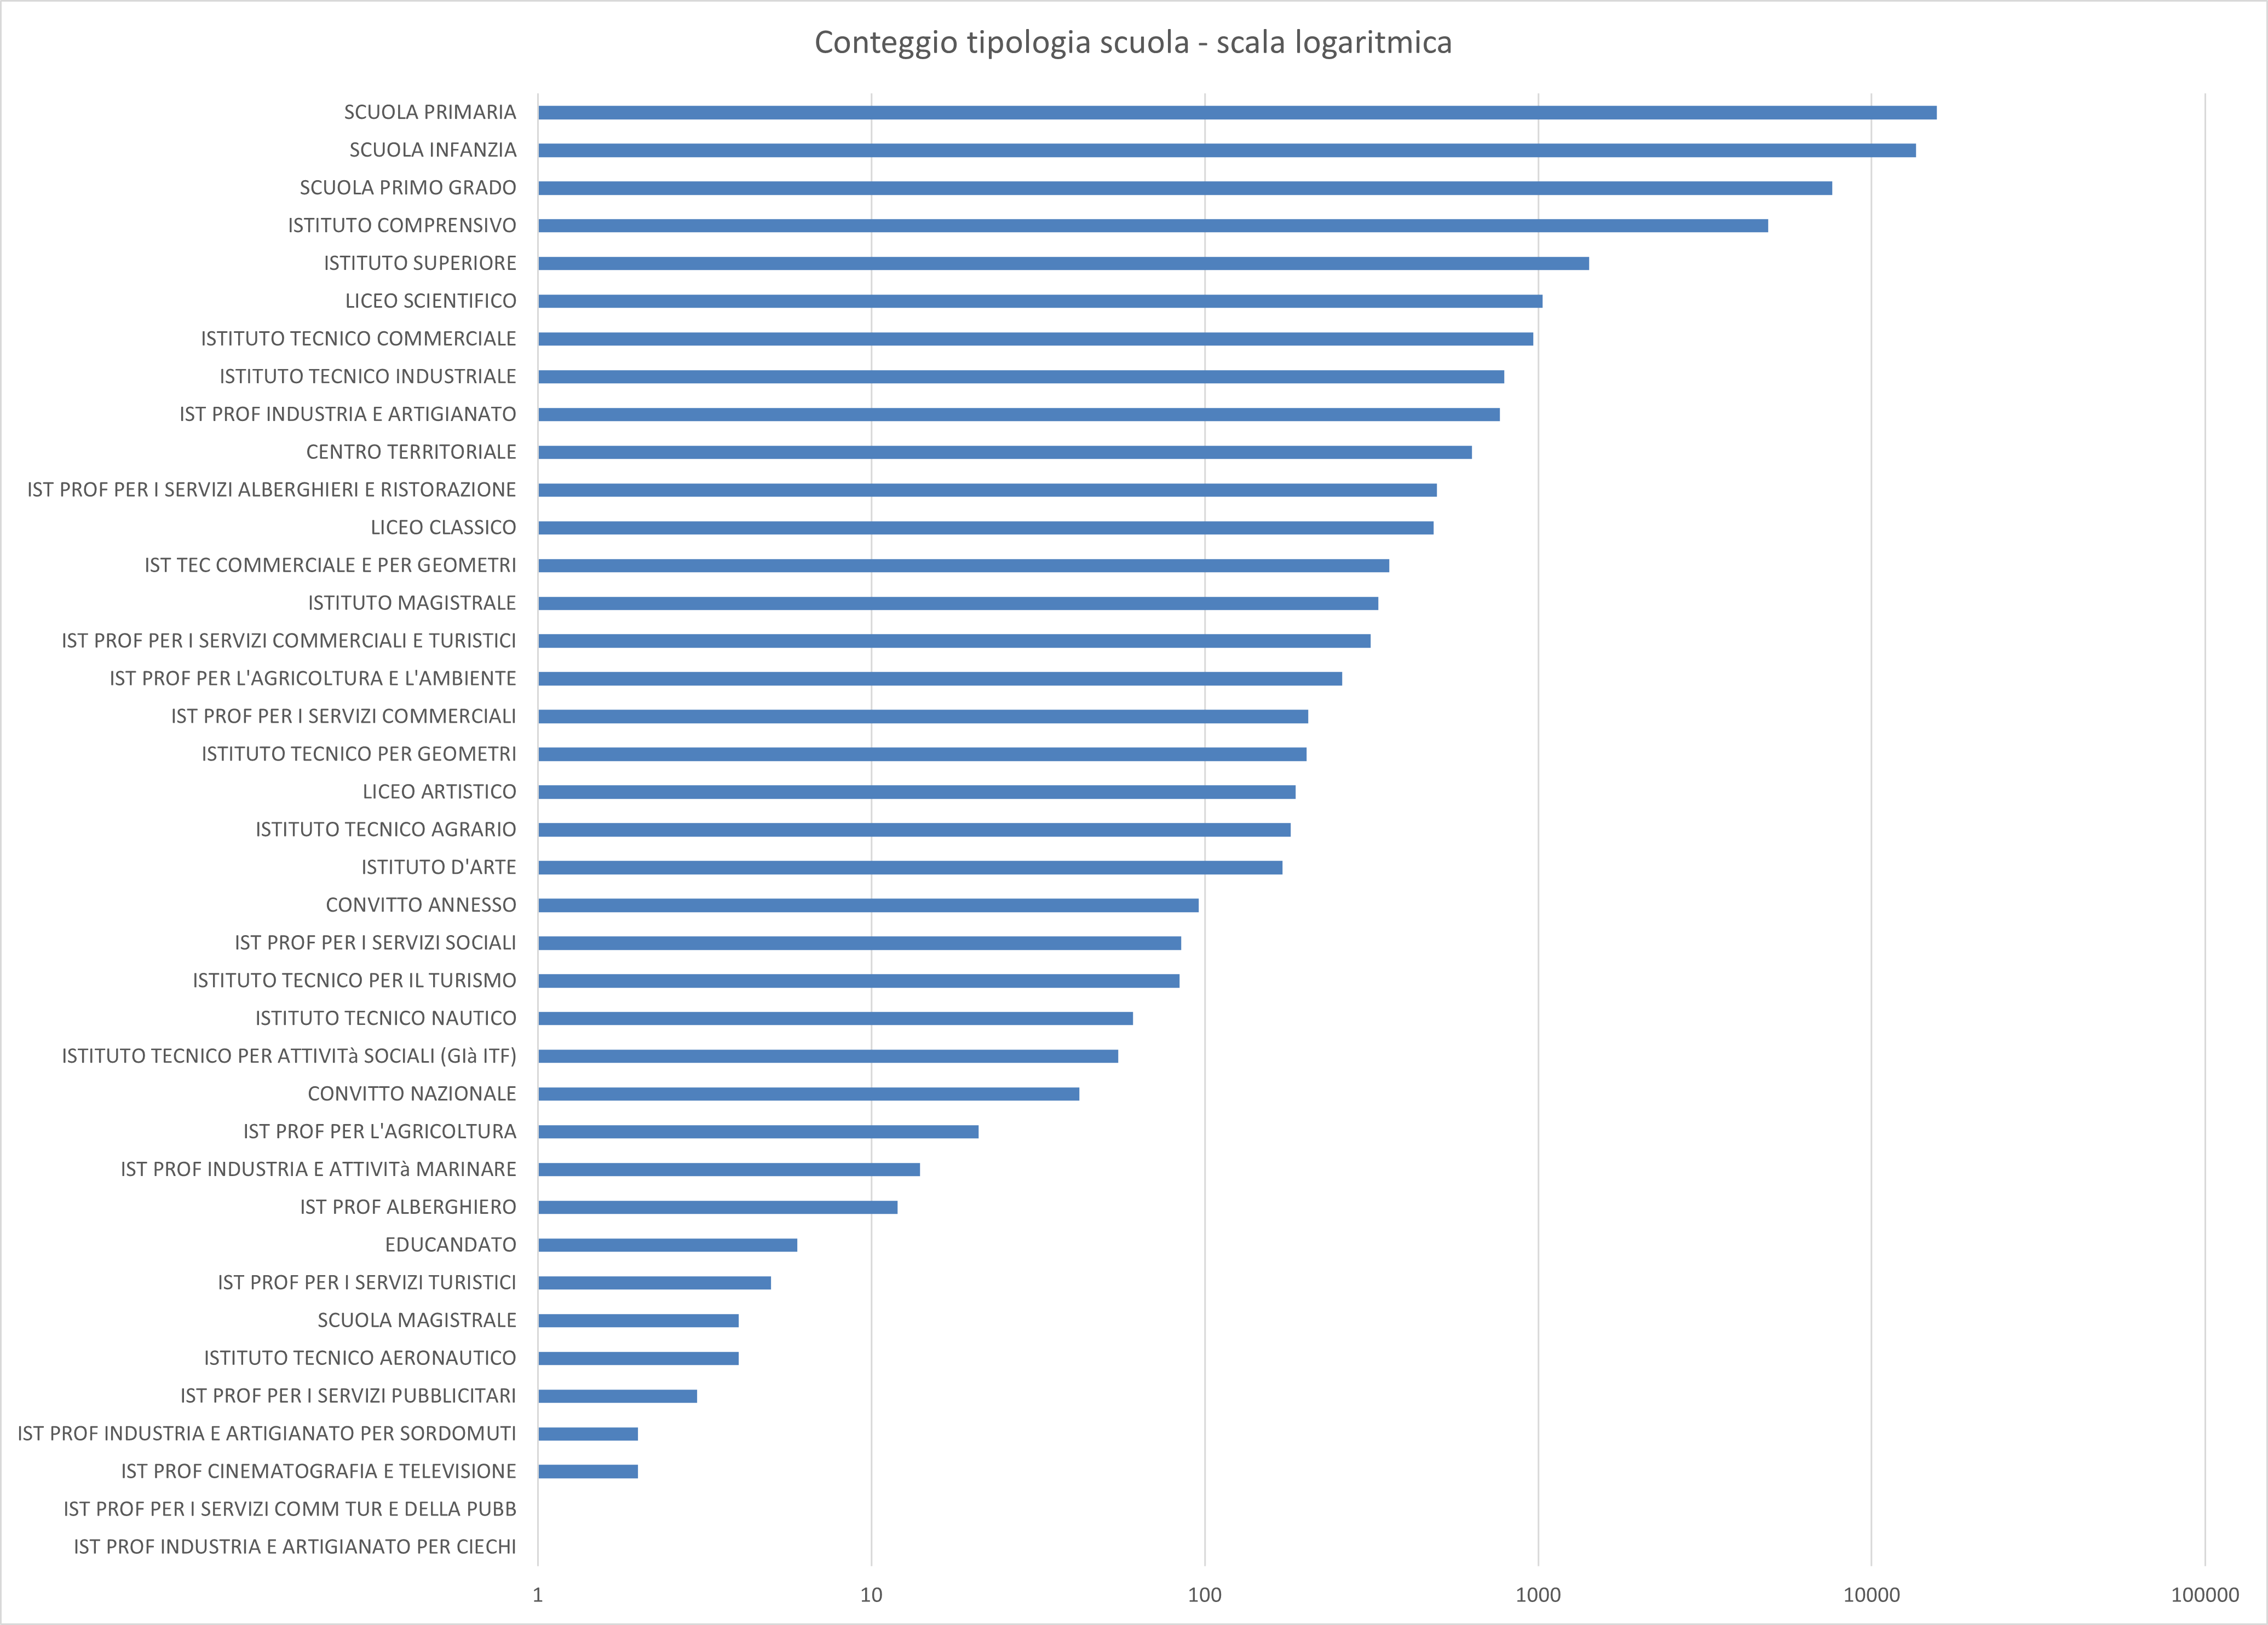
The disparity in school count is significant (e.g., 15,681 records for “Scuola primaria” versus 1-2 records for less common types like “Ist Prof Industria E Artigianato Per Ciechi”). This extreme difference necessitates an adjustment for effective visualization:
-
Linear Scale (Standard): Fails to properly display the count of the less common school types.
-
Logarithmic Scale: To better display the differences among the less represented school types, the Y-axis was formatted to use a logarithmic scale (Right click axis -> Format Axis -> Logarithmic scale selected).
🗺️ 8 Geographical Distribution: Choropleth Map
To visualize the total number of schools per province, the data was extracted from the Pivot Table and used to generate a choropleth map of Italy.
8.1 Map Creation Steps
- Data Preparation: A new sheet named “Schools distribution map” was created. Columns containing the Province and the Count of schools per province were copied from the Pivot Table and pasted using the “Copy Values” option into columns D and E. This step was necessary to prevent Excel from automatically altering the data during map generation.
- Column Renaming: Columns D and E were renamed to “Provincia” and “Numero di scuole per provincia” (Number of schools per province), respectively.
- Map Generation: Columns D and E were selected, and the map was generated using Insert > Maps (Excel automatically detects the geographic names and uses geocoding via Bing Maps to create the choropleth).
8.2 Visualization and Analysis
The map displays the distribution of the total number of schools per province.
- Color Scale: The default two-color sequential scale was modified to a three divergent color scale in red, ranging from light red (lower number of schools) to dark red (higher number of schools).
- Missing Data: Three provinces in the far North (Aosta, Trento, and Bolzano) are displayed in light grey due to missing data for this specific analysis.
- Key Observations:
- The provinces with the highest number of schools are Rome and Naples, followed by Turin and Milan. This trend is generally correlated with the high population density and socio-economic importance of these metropolitan areas.
- Surprisingly, Salerno and Cosenza occupy the fifth and sixth positions, despite not being large metropolitan areas with high population density.
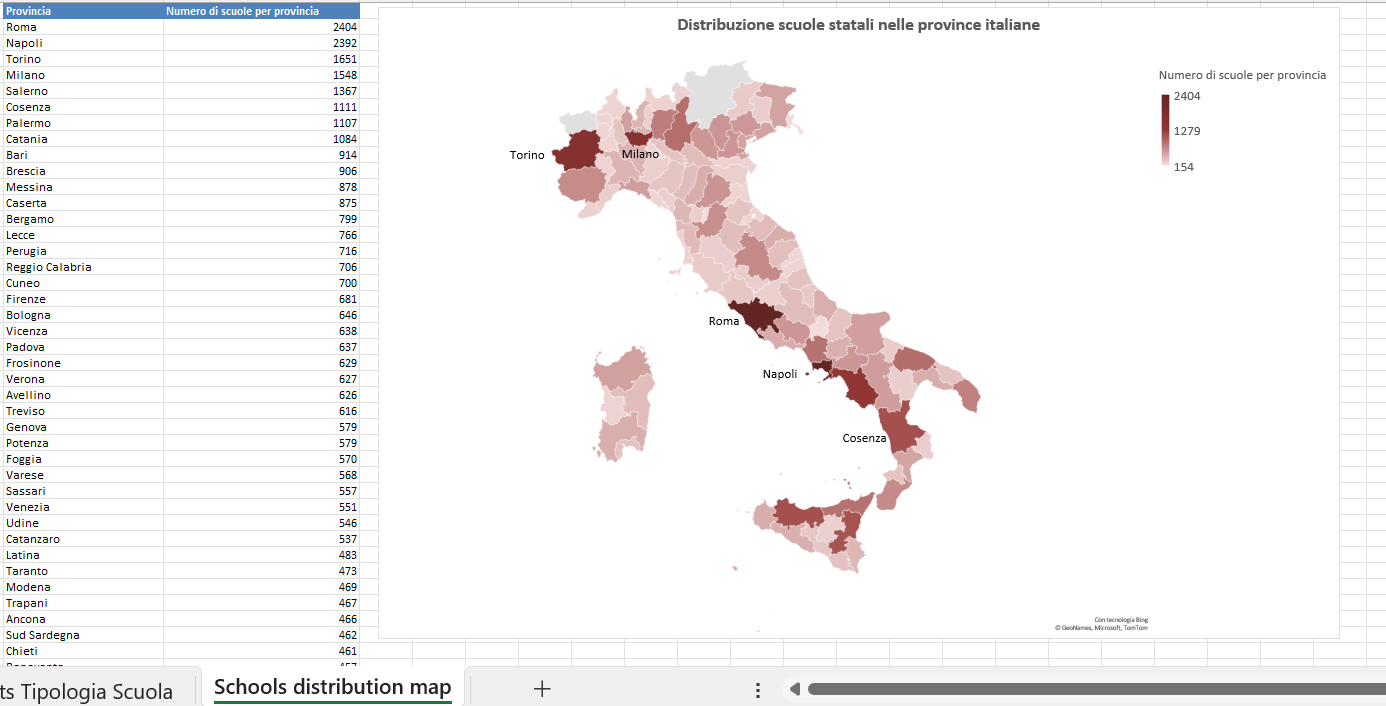
Figure 10: Choropleth map illustrating the number of schools distributed across Italian provinces.
🌎 9 Regional Analysis Setup
To enable analysis at the regional level, the dataset was further enriched by adding the official Italian region name to the main scuole sheet.
9.1 Data Preparation and Region Lookup
- File Duplication: The file
School_Analysis_VLOOKUP_XLOOKUP.xlsxwas copied and renamedSchool_Analysis_by_region.xlsx. - External Data Integration: A lookup file containing official regional data (
province-italiane.xlsfrom the provided source) was downloaded. Columns Sigla, Provincia, and Regione were copied from this external file and pasted into columns E, F, and G of the existingProvincesheet in the new file. - New Column Creation: A new column, “Regione”, was created in the
scuolesheet.
9.2 Lookup Formula for Region
The “Regione” column was populated using the Italian Excel function CERCA.X (XLOOKUP) based on the province abbreviation (Sigla):
Column Regione = CERCA.X(I2; Province!E:E; Province!G:G)
This formula uses the Province Abbreviation (Sigla) from the scuole sheet and looks up the corresponding Regione from the updated Province sheet.
9.3 Visual Confirmation
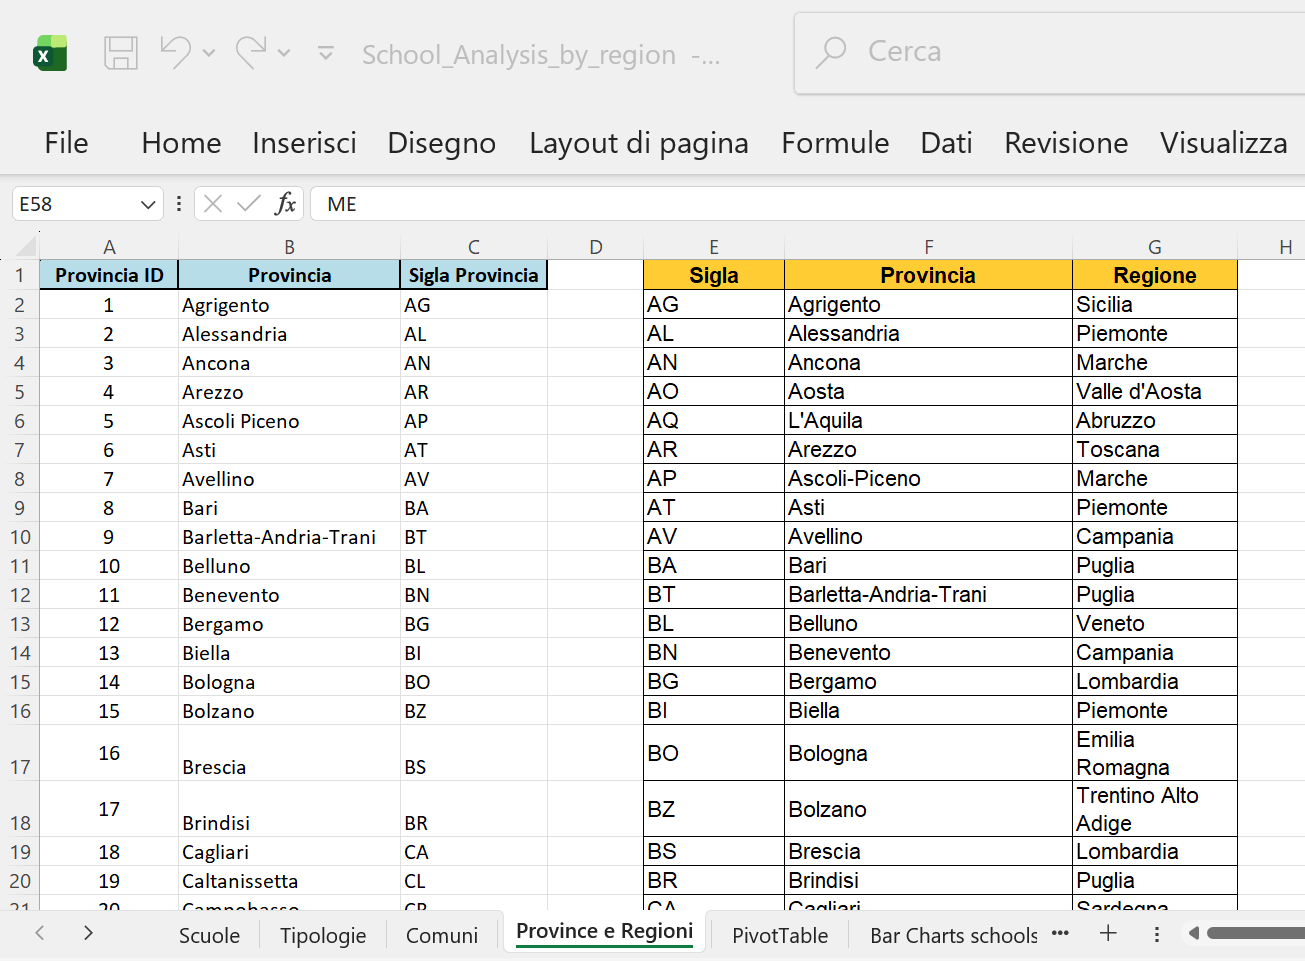
Figure 11: The updated ‘Province’ sheet containing the new ‘Regione’ column (Column G).
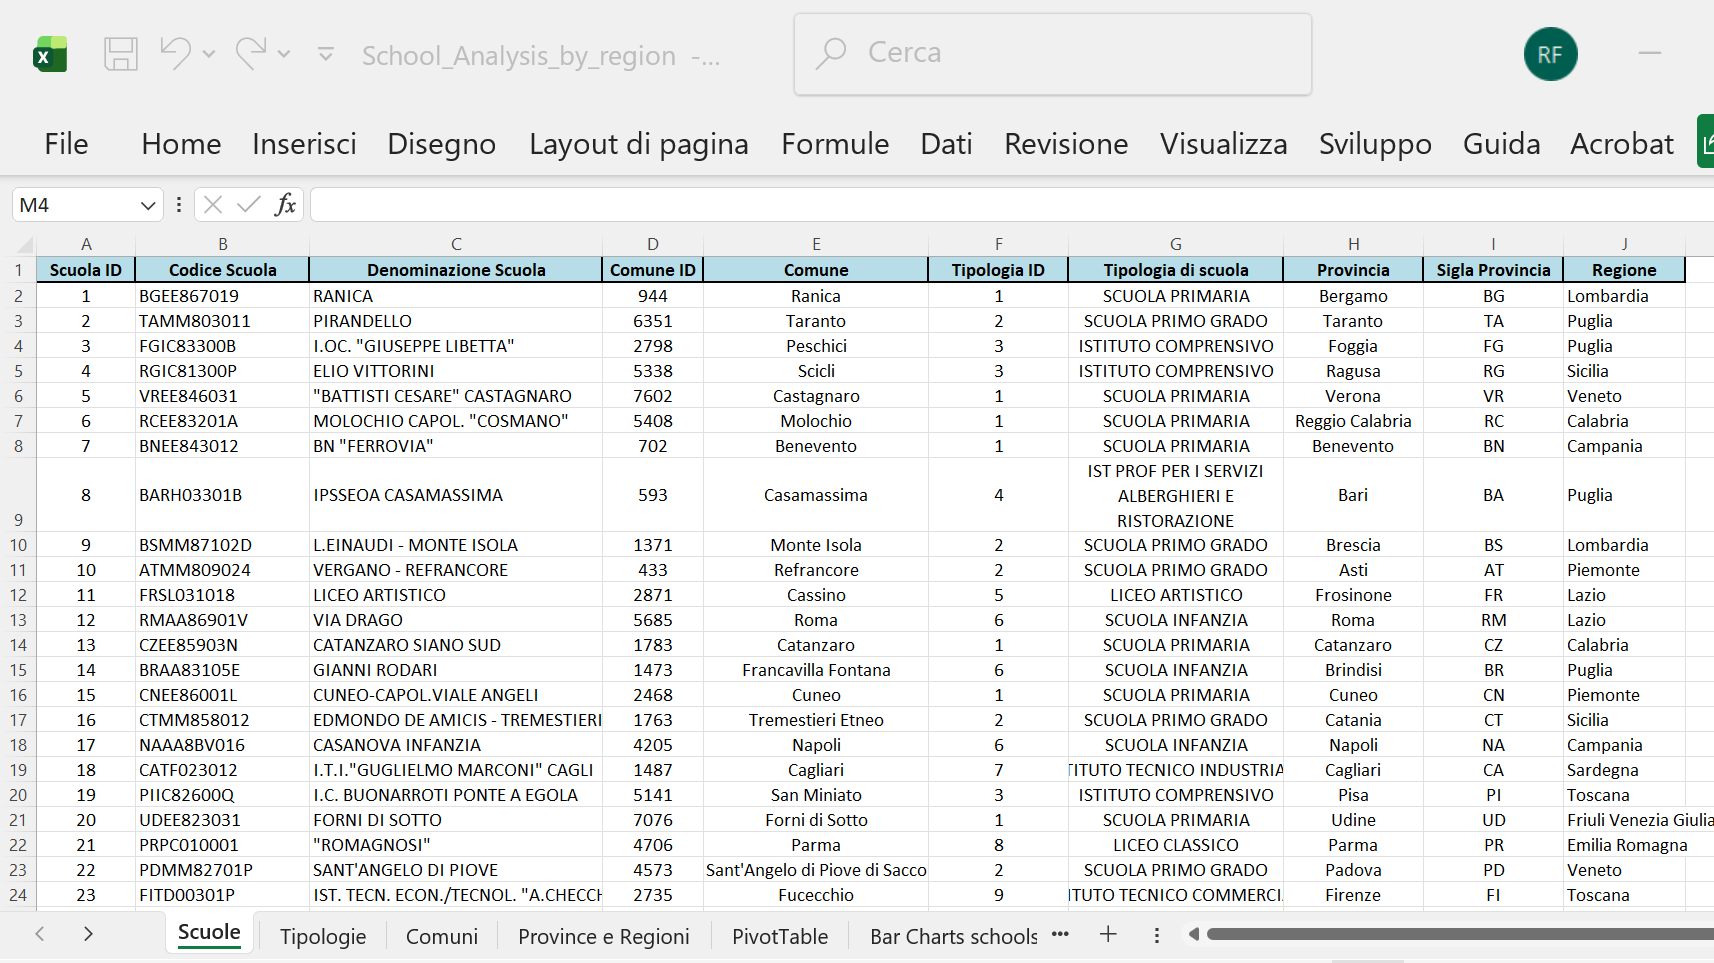
Figure 12: The ‘scuole’ sheet displaying the newly added ‘Regione’ column populated via XLOOKUP.
9.4 Pivot Table Update: Regional Distribution
The previous Pivot Table was deleted and replaced with a new structure to focus the analysis on the Regional distribution of schools, utilizing the newly added ‘Regione’ column.
9.5 New Pivot Table Structure
- Rows: “Regione”
- Values: Count of “Tipologia di Scuola”
This revised structure allows for a high-level view of the number of educational institutions broken down by the 20 Italian regions. The total count remains 51,091 records.
9.6 Regional Analysis Visuals
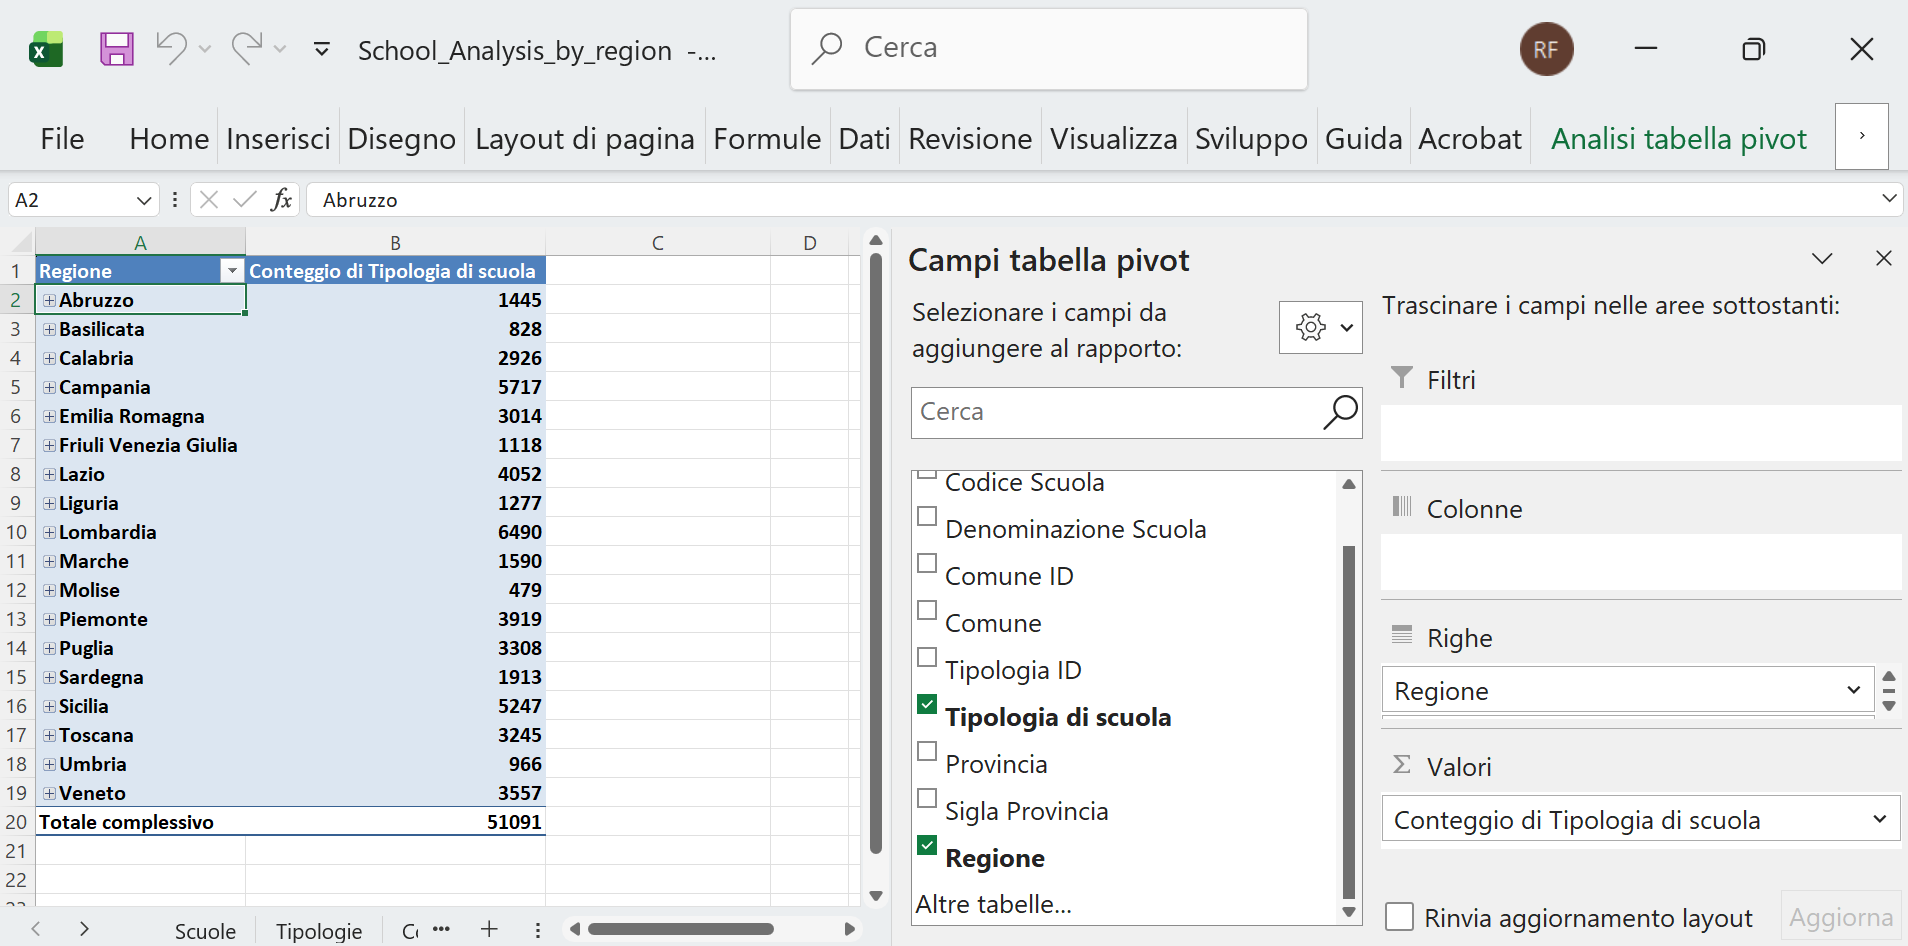
Figure 13: The structure of the updated Pivot Table Analysis, showing ‘Regione’ in the first column, grouped by school type, with a total count of 51,091 records.
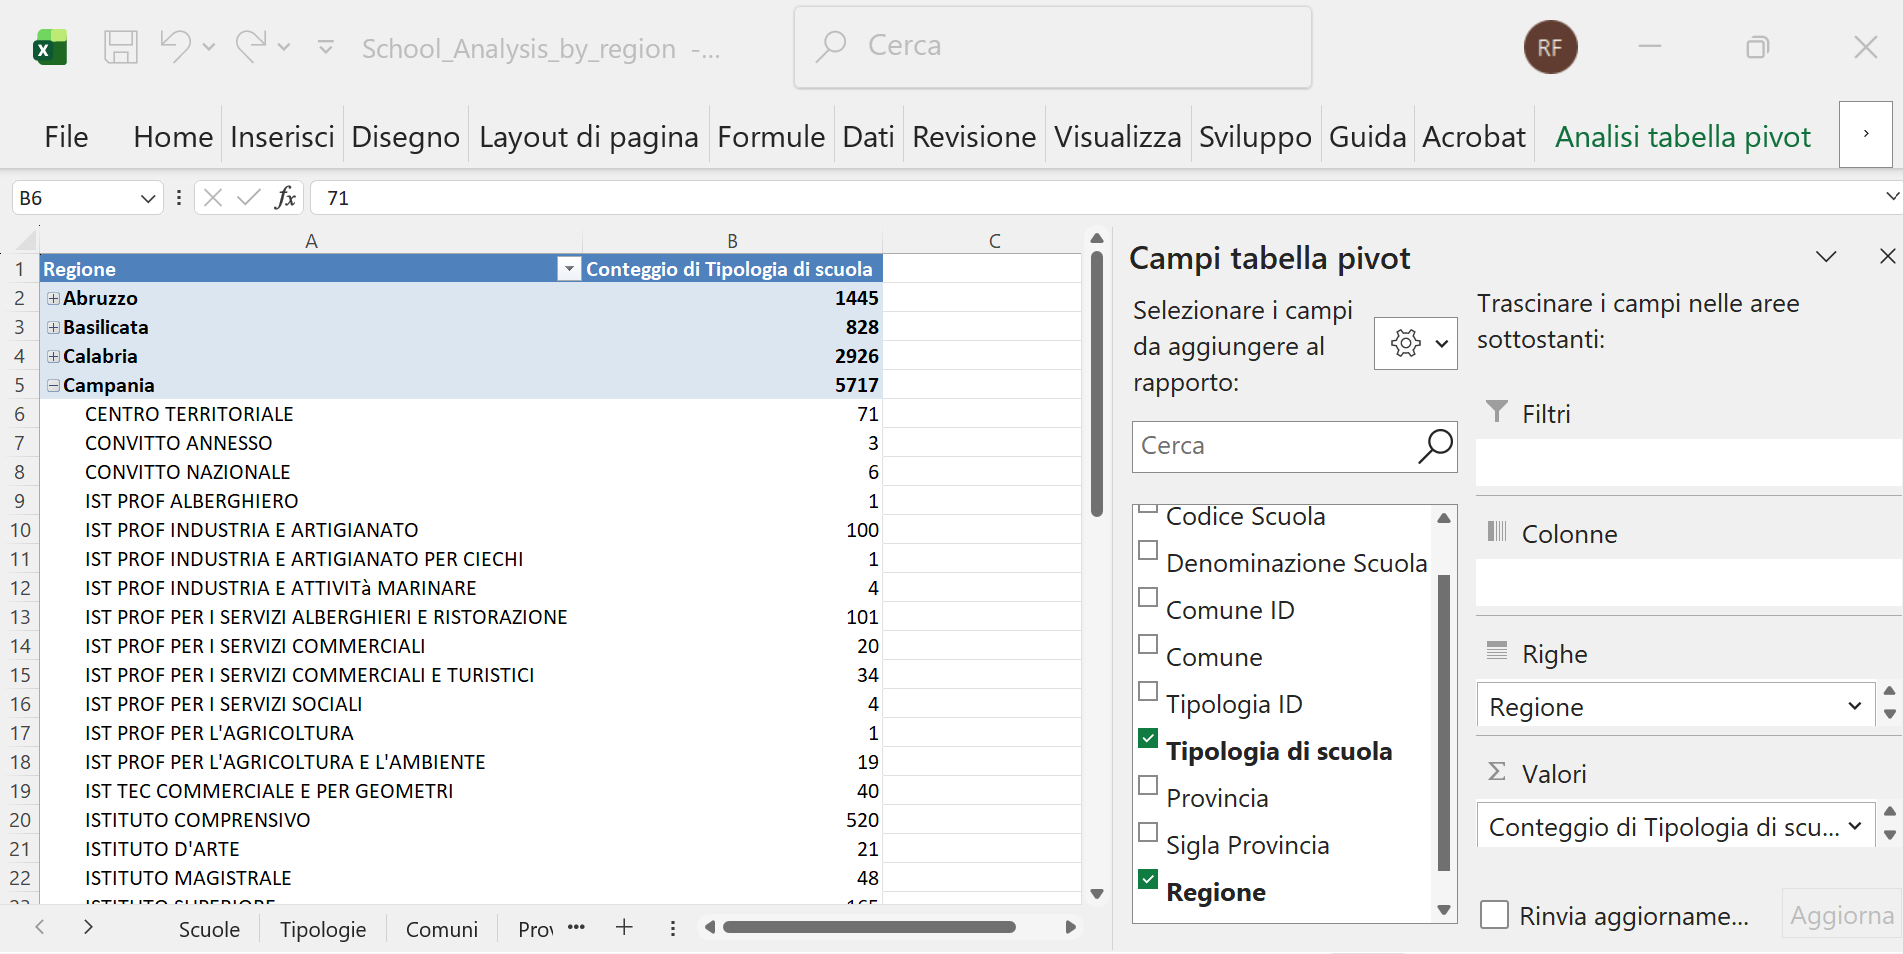
Figure 14: Detailed view of the ‘Campania’ region, showing a total of 5,717 schools grouped by their respective school type (e.g., 71 ‘Centro territoriale’, 3 ‘Convitto annesso’, 6 ‘Convitto Nazionale’, etc.).
10 Visualizing Regional Distribution
The visual analysis was shifted to the regional level using the updated Pivot Table data.
10.1 Chart Creation Steps
- Data Preparation: Existing tables and graphs in the “Bar Charts Tipologia Scuola” sheet were deleted. The new Pivot Table data (grouped by Region) was copied and pasted into this sheet.
- Chart Generation: A new bar chart, titled “Numero di scuole per Regione” (Number of schools per Region), was created based on this data.
10.2 Key Findings and Observations
The analysis reveals the following distribution:
- Highest Concentration: The highest numbers of schools are found in Lombardia, Campania, Sicilia, and Lazio.
- Lowest Concentration: The lowest numbers are found in Friuli Venezia Giulia, Umbria, Basilicata, and Molise.
The distribution generally aligns with the population size and density of the respective regions (reference: https://www.tuttitalia.it/regioni/densita/). However, the relationship is not always linear; for example, Calabria shows a relatively high number of schools compared to its population density. This suggests a potential area for further demographic and socio-economic investigation.
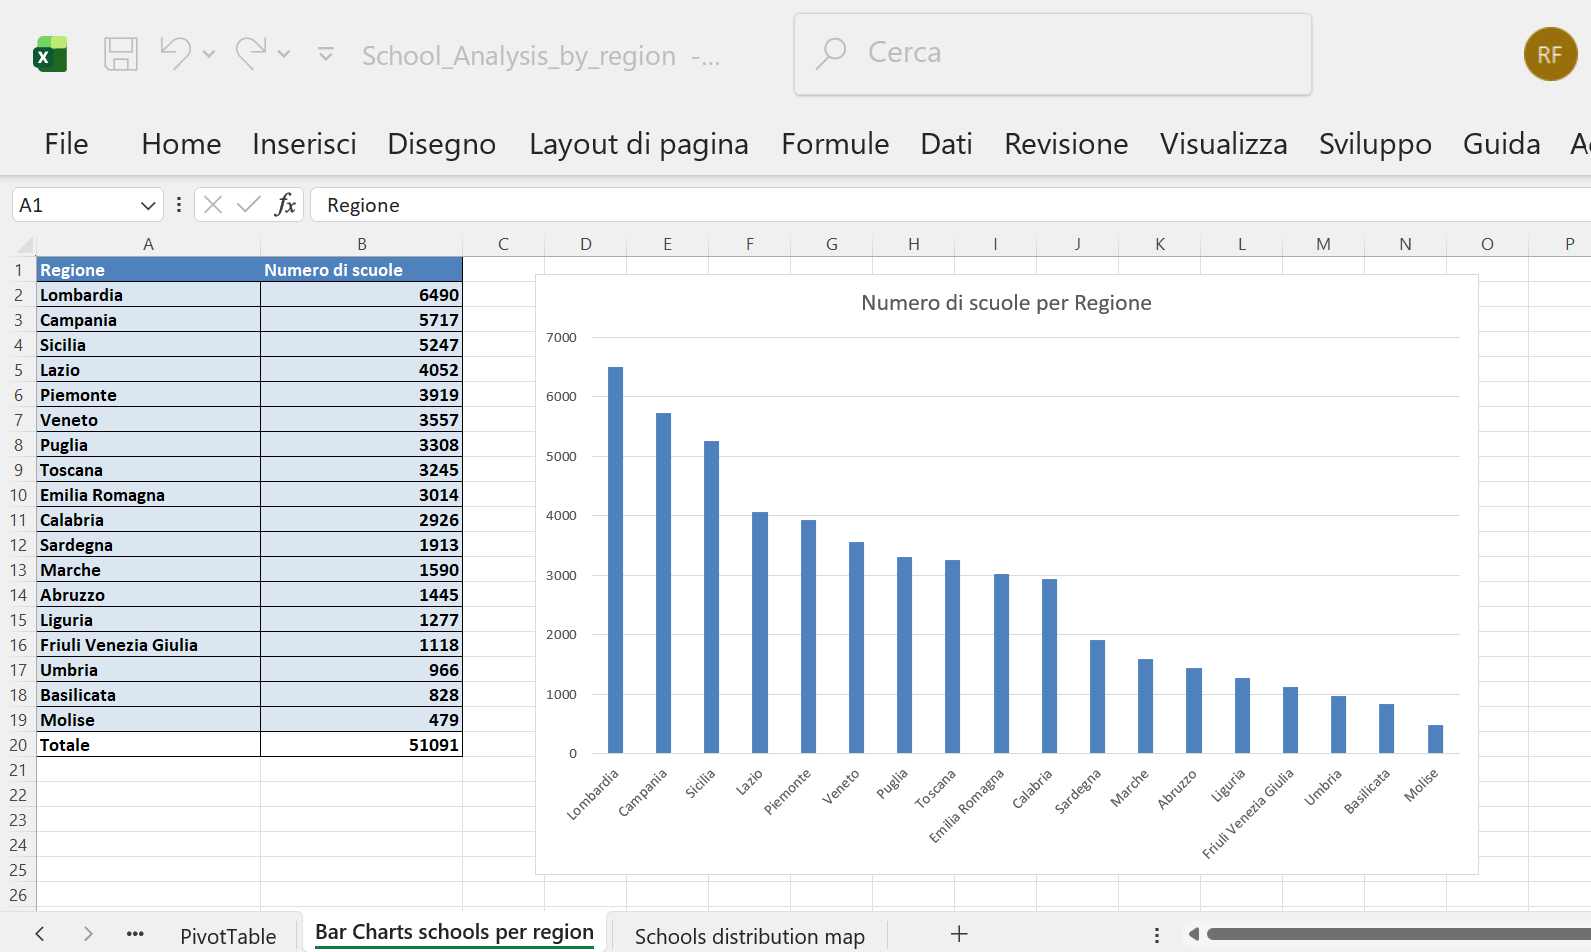
Figure 15: Bar chart showing the number of schools per Italian region.
🗺️ 11 Regional Distribution Map
The final visualization focuses on the high-level geographical distribution of schools across the Italian regions.
11.1 Map Creation Steps
- Data Preparation: The Regioni and Numero di scuole data from the updated Pivot Table was copied into the “Schools distribution map” sheet.
- Map Generation: The map “Distribuzione scuole statali nelle regioni italiane” (Distribution of state schools in Italian regions) was created following the same procedure used for the provincial map (Insert > Maps).
11.2 Visualization Parameters
- Color Scale: The visualization uses a 3-Color Scale (divergent) in green for clear distinction.
- Scale Values: The parameters were manually set to:
- Minimum: 400
- Midpoint: 2,500
- Maximum: 5,000
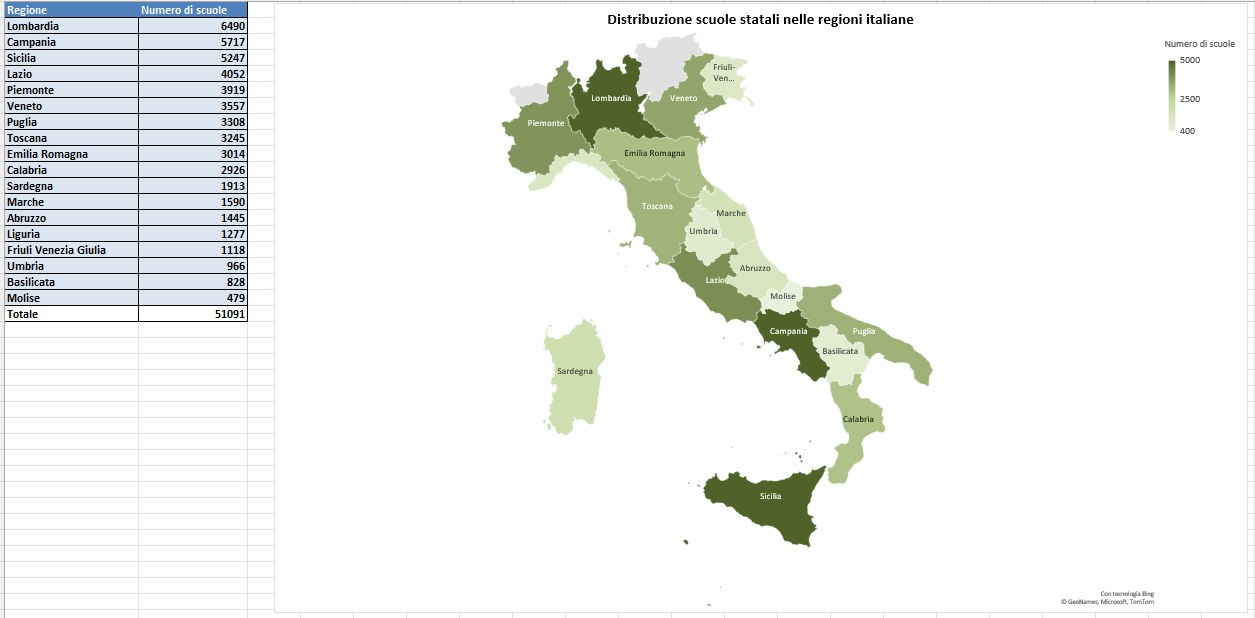
Figure 16: Choropleth map illustrating the final distribution of state schools across the Italian regions, using a green 3-color scale.
🏆 12 Conclusion and Usage
This project successfully demonstrates the process of transforming complex, raw data into a relational model within Excel for robust analysis. The structured data model (using the scuole, tipologie, comuni, and province sheets) allows for efficient creation of pivot tables, bar charts, and geographical visualizations to explore patterns in the Italian educational landscape.
12.1 Next Steps for Analysis
The files (School_Analysis_VLOOKUP_XLOOKUP.xlsx and School_Analysis_by_region.xlsx) are ready for any user to perform further queries, such as:
- Drill-down: Investigate the specific number of schools for a particular municipality (using the ‘Comune’ field in the Pivot Table).
- Ratio Analysis: Calculate the ratio of schools per capita in different regions to normalize the data and refine geographical observations (e.g., comparing Calabria’s school count to its population density).
12.2 File Usage
To explore the analysis and replicate the steps documented above:
- Download: Clone the repository and download the analysis files (
School_Analysis.xlsx, etc.). - Open: Use Microsoft Excel (or compatible software) to open
School_Analysis_by_region.xlsx. - Explore: Navigate through the sheets (
scuole,PivotTable,Schools distribution map, etc.) to review the data model, formulas, and final visualizations.